
Functional Requirements
- FR1: Trigger workflows on each Git push using the repo-defined workflow file.
- FR2: Run workflows in isolated sandboxes with scoped secrets.
- FR3: Provide real-time visibility into execution (status, step progress, logs).
Non-function Requirements
- NFR1: The system shall support concurrent execution of at least 100,000 jobs across the cluster.
- NFR2: The system shall enforce per-job container isolation to limit blast radius and prevent cross-workflow interference.
- NFR3: The system shall enforce per-organization/repo quotas to guarantee fairness and prevent noisy-neighbor effects.
- NFR4: The system shall persist workflow state and artifacts across failures to enable safe recovery.
- NFR5: The system shall process workflow triggers within 10 seconds of receiving a Git event during peak time.
High Level Design
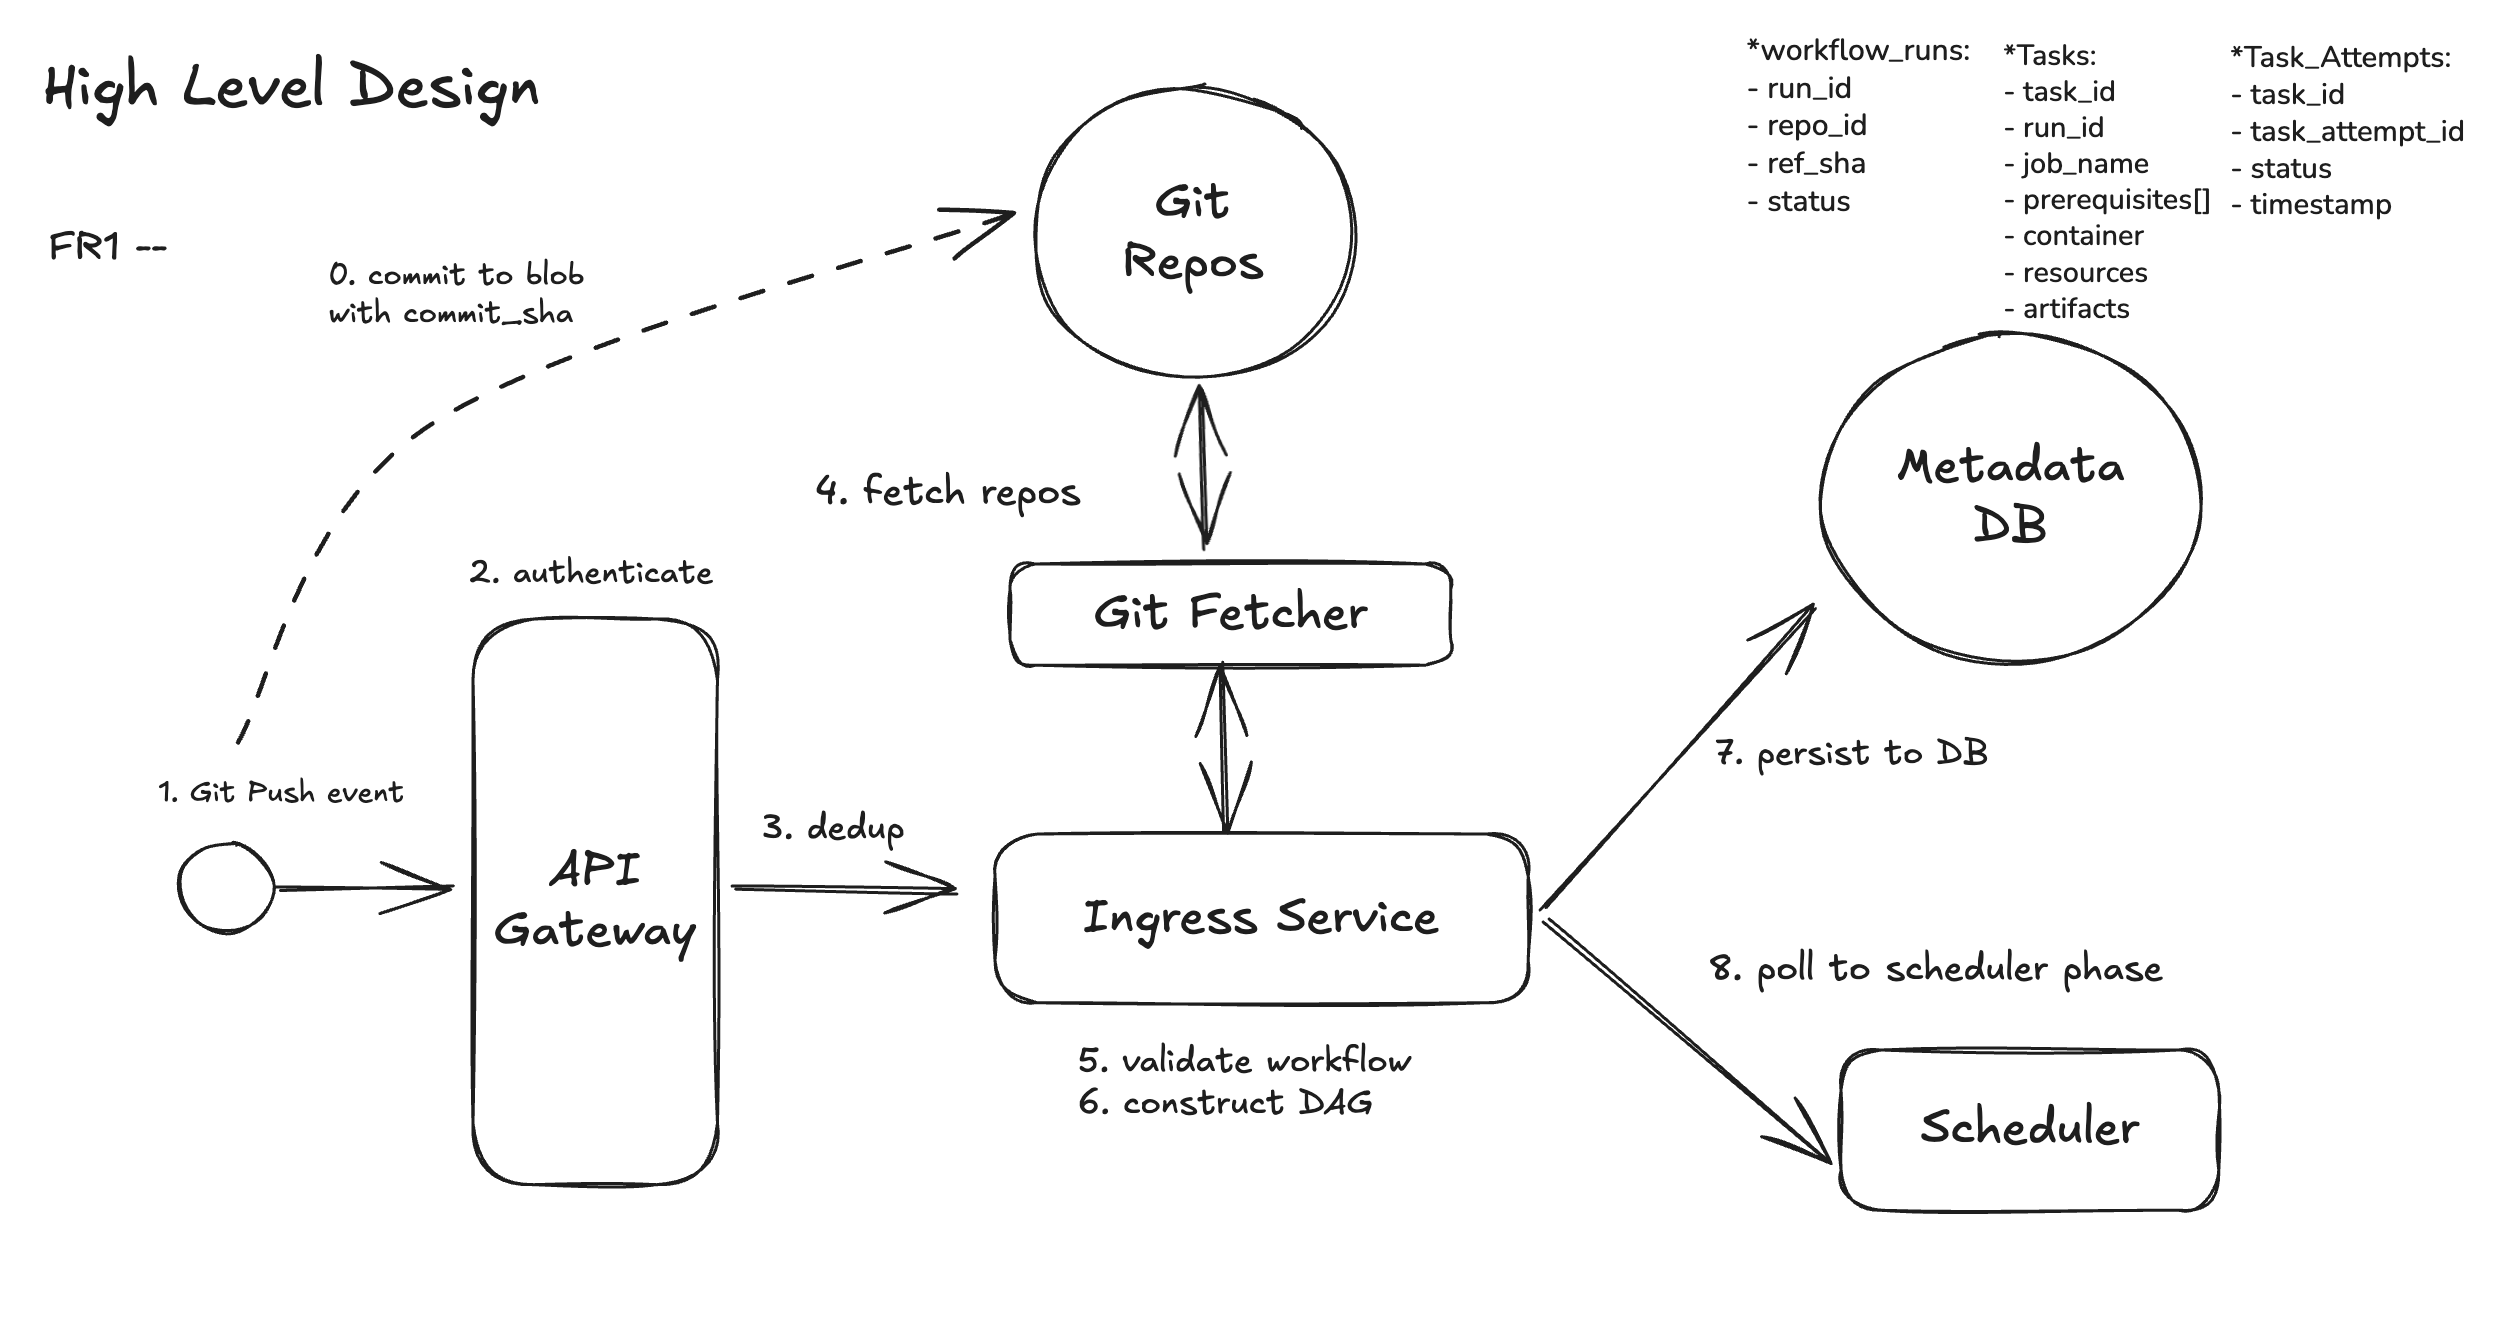
FR1: Trigger workflows on each Git push using the repo-defined workflow file.
In a modern CI/CD system, every pipeline is triggered by a Git event — such as a push, pull request, or merge. To manage this reliably at scale, we introduce an Ingress Service as the entry point. The Ingress Service receives these Git events via provider webhooks (e.g., GitHub), fetches the workflow definition pinned to the commit SHA, validates it, constructs a DAG of jobs and dependencies, and persists a durable workflow run plan. This plan is designed to be recoverable, replayable, and observable, serving as the single source of truth for reliable downstream execution.
Core Responsibilities covered in this function requirements
- Event ingestion & authentication: Securely receive and validate webhook events from Git providers.
- Dedup: Git providers use at-least-once delivery, so events may be resent due to retries or network issues, and therefore the system needs dedup.
- Workflow retrieval: Fetch the workflow definition pinned to the referenced commit SHA.
- Validation: Ensure configuration correctness, syntax validity, and policy compliance.
- Execution planning: Build a DAG of jobs and dependencies, then persist the run plan in a durable storage.
Key Design Principles
- Asynchronous-first: Acknowledge webhooks quickly; defer heavy lifting off the hot path.
- Exactly-once delivery: Deduplicate at ingress, preserve immutability, and ensure events are consumed reliably.
- Durable state persistence: The system should persist workflow state and artifacts so that execution can survive crashes, support recovery, and provide auditability.
Entities
GitHub Event → WorkflowRun (one per trigger) → Tasks (one per task, DAG edges from prerequisites[]) → TaskAttempts (one per execution try).
Repository— A registered source code repository within the CI/CD system. It is the origin ofworkflowdefinitions and the source of truth for pipeline execution.Workflow_Run— A versioned specification, tied to a specific commit, that defines the pipeline. It declaresTask, their dependencies, and the steps each job must execute.Task— A single node within theworkflow’sDAG. Eachtaskis executed in its own isolated environment (e.g., container, VM, or sandbox) to ensure reproducibility and fault isolation.Task_Attempt— An individual execution of atask. Each attempt represents a concrete command or action run by the system, ordered and tracked for retries, logging, and observability.
Let’s walk through how this works step by step.
Step 1: Github Push Event
GitHub Actions is powered internally by GitHub’s event system, which is built on webhooks. When something happens (push, pull request, issue comment, release, etc.), GitHub fires an internal webhook-like event.
Step 2: Authenticate Github Action Event
The first responsibility is to authenticate the event via API Gateway, since processing an unauthenticated or replayed request could allow attackers to trigger arbitrary builds or replay past builds.
Step 3: Deduplication
Git providers use at-least-once delivery, meaning the same event may be sent multiple times due to retries, delays, or transient network failures. Without protection, this can cause duplicate workflow runs, wasted compute, and inconsistent system state. It will be described more in DD 1.
Step 4: Fetch & Validate Workflow Definition
Once the event is authenticated and deduplicated, we fetch the workflow definition (e.g., .ci/workflows.yaml) pinned to the exact commit SHA referenced in the event.
Step 5: Parse and Validate the Workflow
After fetching, the workflow YAML is parsed into an internal representation of jobs and dependencies. But we don’t stop at syntax checks—validation is multi-layered to enforce correctness and policy:
- Schema validation: fields, formats, types.
- Policy linting: enforce org rules.
- Semantic validation: detect cycles in the
prerequisites[],downstream[]graph from task, invalid job references, undeclared/reused artifact names.
Step 6: Construct DAG
Once validated, the workflow definition is transformed into a Directed Acyclic Graph (DAG) of tasks. The execution model is layered:
This structure ensures durability (workflow state survives crashes), parallelism (jobs can be scheduled independently), and auditability (every run, job, and retry is traceable).
1. Workflow_run: Provides a reliable top-level object for retries, history, and observability — even if schedulers crash.
- Captures the entire triggered workflow as a durable record.
- Links together the GitHub event, commit SHA, workflow file, and run status.
2. Tasks: Breaking runs into tasks exposes parallelism, enforces dependencies, and isolates execution.
- Each task in the YAML becomes a Task node in the DAG.
- Dependencies are modeled as edges; matrix strategies expand into multiple task variants.
- Stores specs: image, command, resources, timeouts, artifact contracts, and retry limits.
3. Task_Attempts: Attempts make transitions idempotent and auditable — retries don’t corrupt prior state.
- Every actual execution is a Task_Attempt row, recording worker ID, start/end times, exit codes, and logs.
- Retries create new attempts instead of overwriting history.
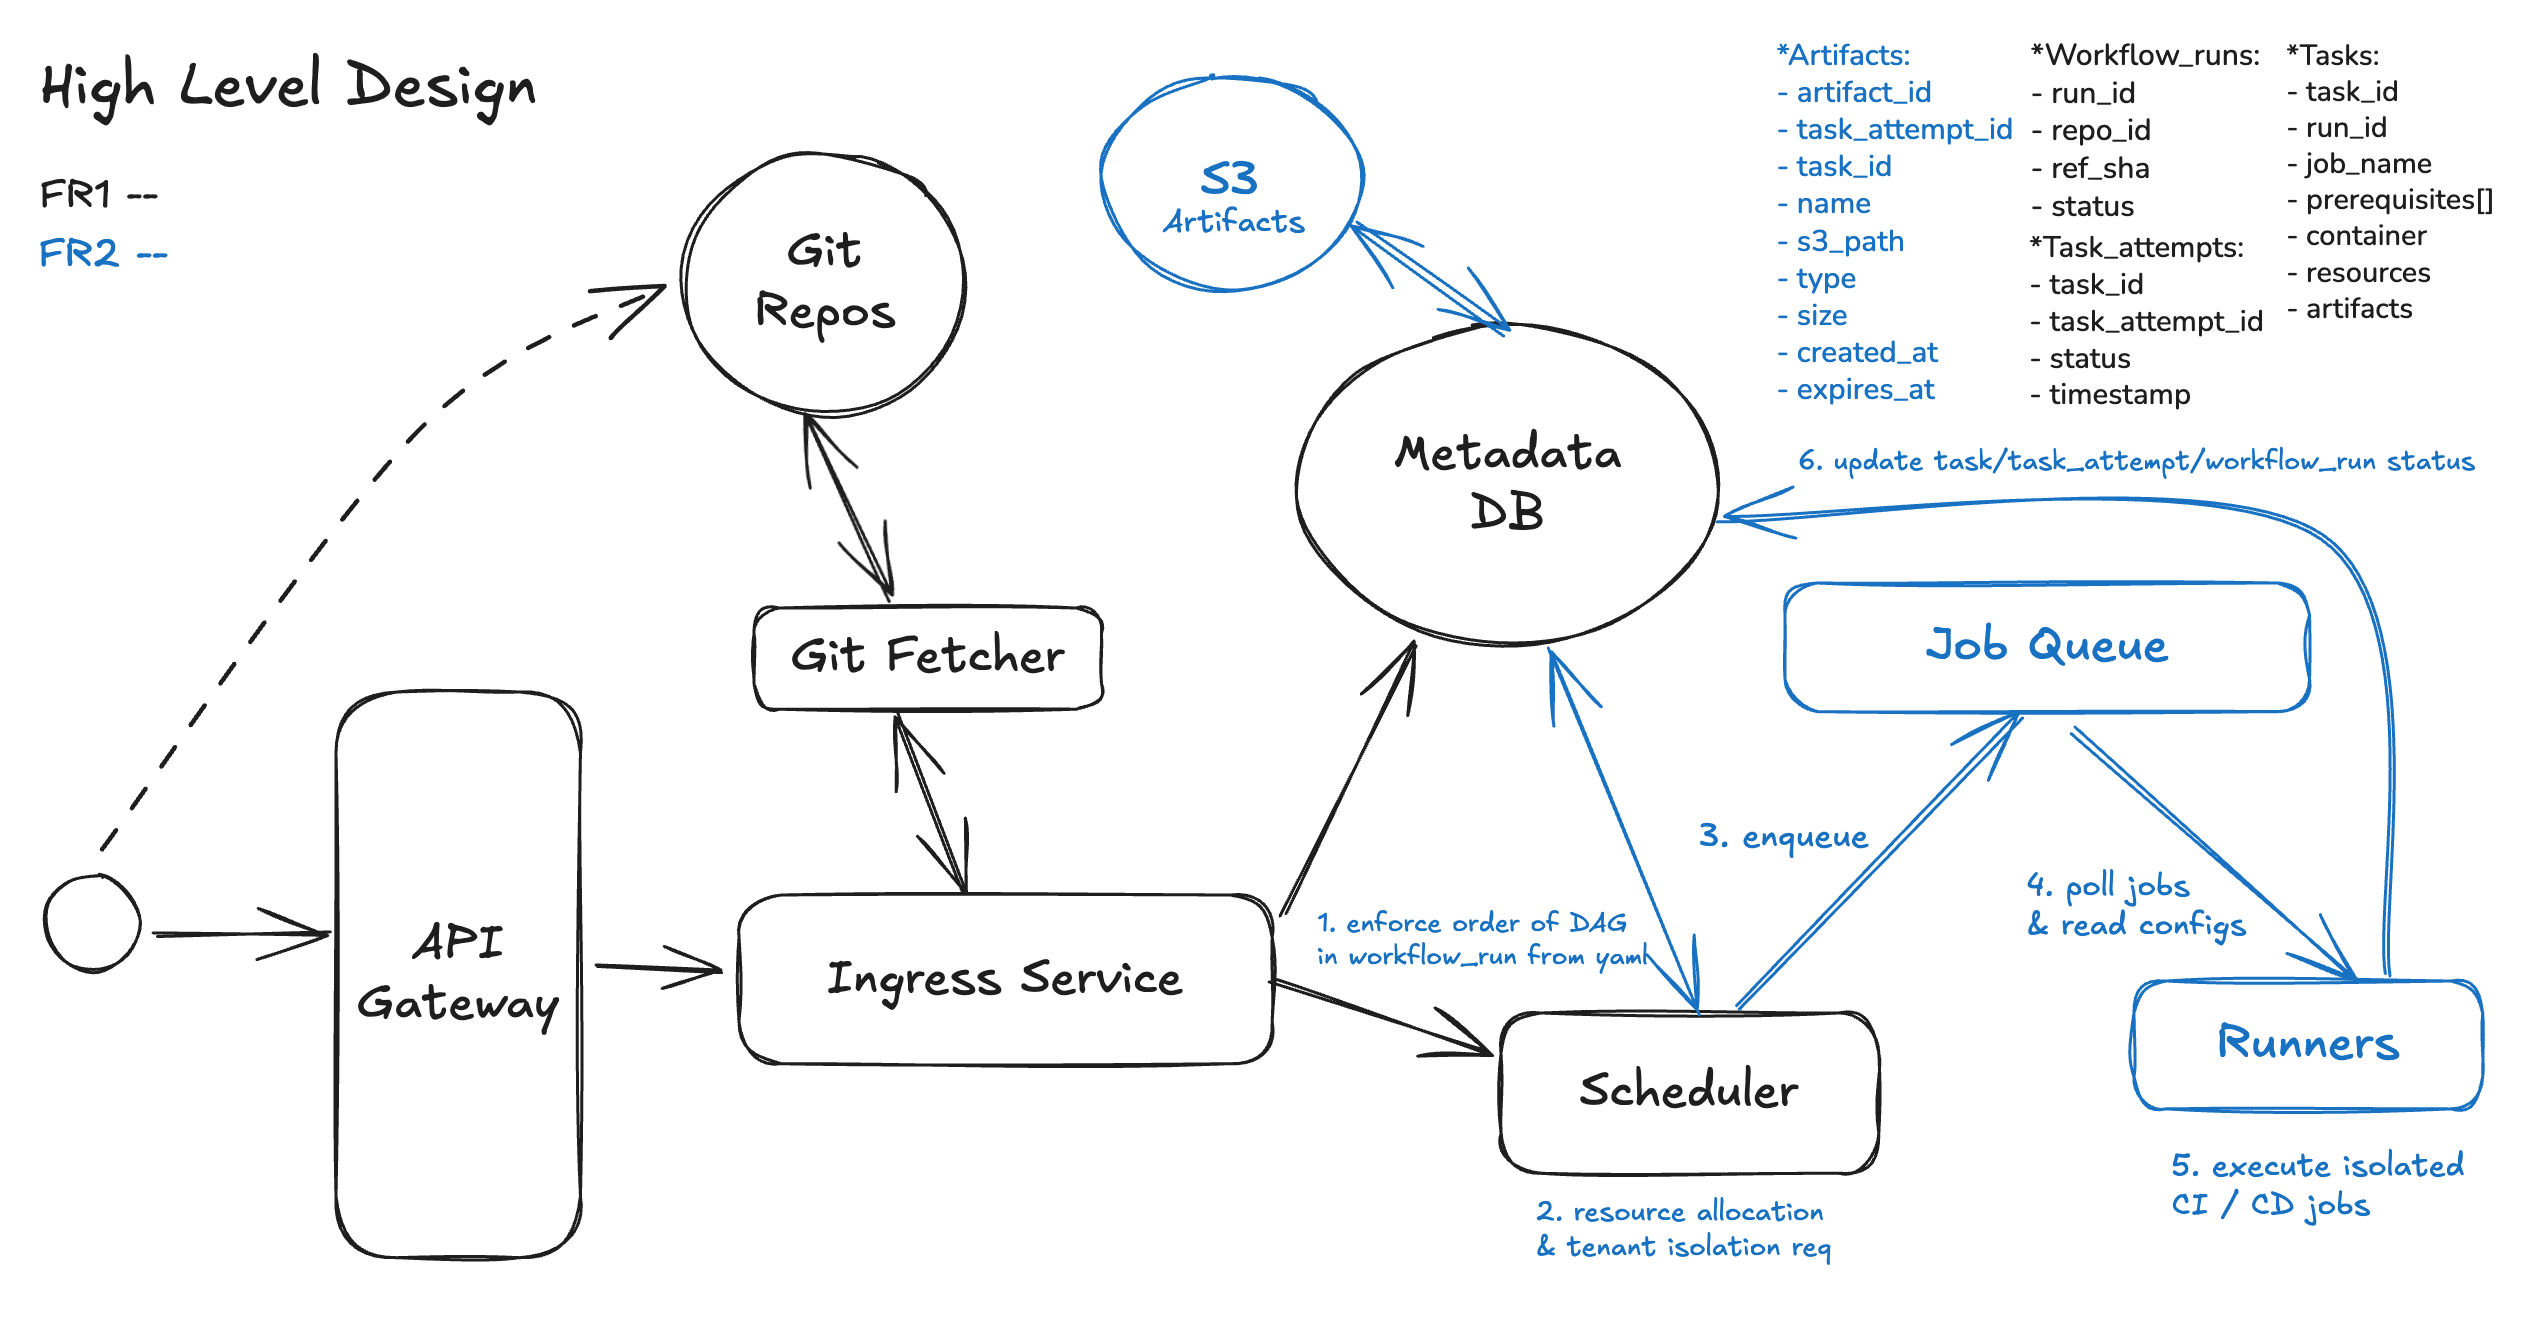
FR2: Schedule and execute workflow jobs in isolated container environments
Once the Ingress Service has parsed the workflow and persisted the task DAG, the system control passes to the Scheduler, which is responsible for driving execution across distributed, containerized workers. Here are the primary responsibilities of this schedule and execution part:
- Enforce execution order based on the DAG
- Efficiently allocate compute resources across jobs, this ensures multi-tenant fairness
- Enforce tenant isolation and security
- Build Artifacts Sharing among execution runners
Entities:
Artifact - File(build, logs etc) produced by a task or task_attempt .
Let’s go through how to achieve those design goals above:
Step 1: Enforce execution order based on the DAG
Scheduler has to scan all tasks repeatedly to figure out which ones can run.
- Each scheduling cycle, it checks every task in the workflow run.
- For each task, it looks at the
prerequisites[]list and verifies if all prerequisites are complete.
This works for small DAGs, but at scale (thousands of jobs per workflow or thousands of workflows at once), it becomes expensive and inefficient — wasting CPU cycles re-checking blocked tasks. And it also makes fairness harder, since the scheduler has no quick way to prioritize just the runnable tasks.
Step 2: Efficiently allocate compute resources across jobs
In a CI/CD system, every Git event can trigger dozens or even hundreds of jobs, all competing for shared compute. These jobs may demand very different resources — from lightweight lint checks to GPU-heavy integration tests. If we don’t manage allocation carefully, we risk 3 big issues:
- a single team monopolizing the cluster
- noisy neighbors degrading performance
- critical jobs like hotfix deploys getting delayed behind less important work
Step 3: Task_attemp Enqueue to Job Queue
When a job is ready to run, the scheduler creates a task attempt—a record representing one execution of that job—and places it into a distributed job queue. This queue acts as a buffer between the scheduling logic and the compute layer, ensuring that tasks are stored reliably, can be retried if needed, and are available for any available runner to pick up when capacity allows.
Step 4: Runners Pull from Queue
Runner agents, which are the workers that actually execute CI/CD tasks, continuously poll the job queue for available work. When a runner claims a task, it reserves the job, prepares an isolated execution environment (e.g., container or VM), pulls the required code and dependencies, and then runs the defined steps, reporting logs, status, and artifacts back to the CI/CD system.
Step 5: Isolated Execution
Each task runs in its own sandbox, typically materialized as a Pod (containers) in Kubernetes or an Micro Virtual Machines. At launch, the system injects the full execution context:
- Image & command — the container image (digest-pinned for immutability) and the command to execute.
- Secrets — short-lived credentials injected at runtime (via environment variables or mounted volumes), scoped only to that task.
- Artifacts
- Inputs: pulled from the artifact storage (e.g., build outputs, test datasets) before execution.
- Outputs: uploaded back into the artifact storage under a versioned path, ensuring immutability and traceability for downstream tasks.
- Isolation controls — namespaces, quotas, and network policies that sandbox each execution and prevent noisy-neighbor effects.
Step 6: Build Output (Artifacts) Publishing
Build artifacts are the output files generated during the CI (Continuous Integration) phase. These are the deliverables of a build job that downstream jobs — including deployment — will rely on. Common examples include:
- Compiled binaries (e.g.,
.jar,.exe,.wasm) - Docker images
- Static web assets (e.g.,
.js,.css,.html) - Configuration files, schemas, or signed packages
- Test reports, logs, or coverage summaries
In a modern CI/CD system, CI and CD often run on separate compute nodes or even different clusters. To decouple them while maintaining correctness, build artifacts act as a contract between these stages.
Down below, we will go through how CI/CD workers integrate with artifact storage.
CI Worker (Build Phase)
After building, the CI job uploads artifacts to a durable artifact store, such as:
- Object storage (e.g., S3, GCS)
- Container registry (e.g., ECR, GCR)
Artifacts are content-addressed (via SHA) or version-tagged for immutability. Metadata (e.g., commit SHA, run ID, checksum) is persisted to track lineage.
Artifact Metadata
Centralized Artifact Metadata ensures that artifacts:
- Are durable and recoverable
- Can be fetched independently of the original build node
- Support retries, rollbacks, and auditing
CD Worker (Deploy Phase)
When deployment jobs are triggered, they fetch the relevant artifacts using a unique identifier (e.g., commit SHA or version tag). The CD pipeline does not re-build — it relies on the previously stored, validated artifacts. This allows safe, reproducible deployments, even if the original code branch has changed.
Although this post mainly covers workflow management and notification flow, it’s also helpful for interviews to understand how CI/CD workers function internally in case interviewers probe for deeper details.
FR3: Provide real-time visibility into execution (status, step progress, logs).
Once a CI/CD workflow is triggered, engineers expect a live view of what’s happening — not just after-the-fact results. This FR focuses on delivering real-time feedback loops that allow developers to observe, debug, and react as their workflow progresses. Once a workflow is triggered and the DAG is persisted, the CI/CD system doesn’t just execute jobs — it also needs to manage the full lifecycle of those executions: tracking what happened, supporting manual recovery, and enabling data to flow cleanly between jobs and environments.
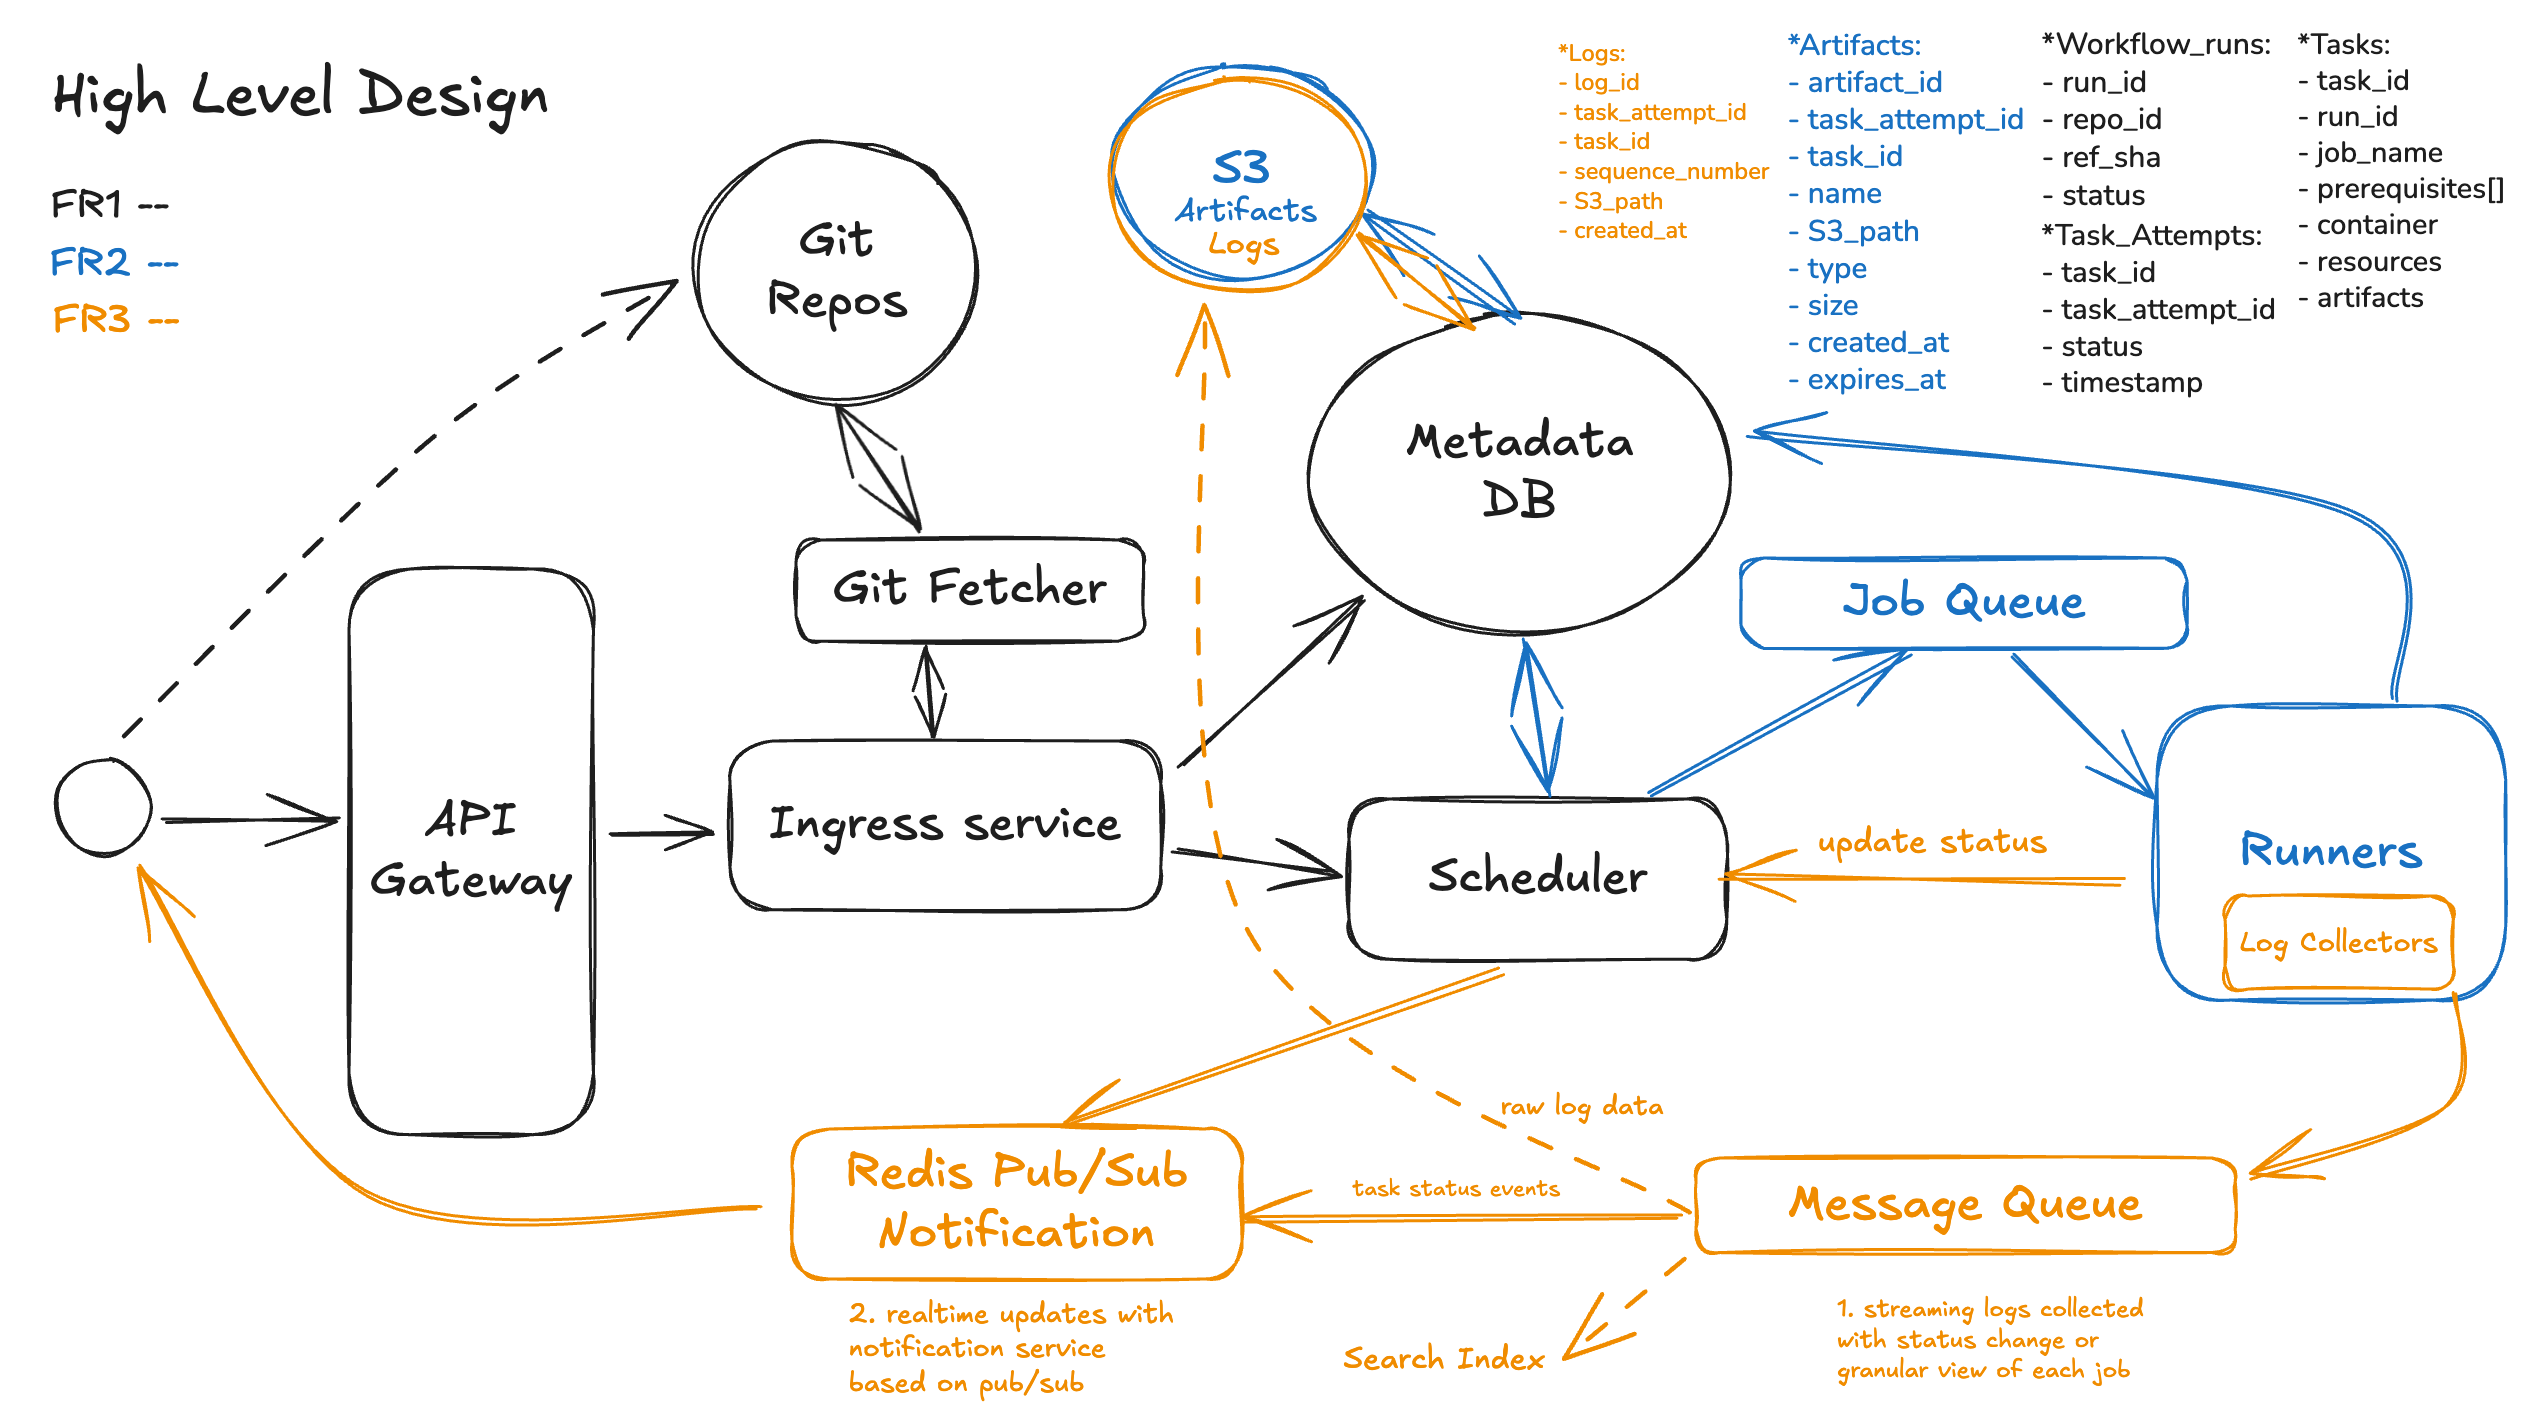
Step 1. Streaming Logs
Each task (or task_attempts) produces logs that are streamed live to both the UI and persistent storage.
- Executors stream
stdoutandstderrto a log collector , which:- Buffers logs locally (to survive network flaps)
- Batches and ships logs to a central pipeline (e.g., Kafka → log store)
- Tags logs with
(workflow_run_id, job_name, step_name, attempt_id)
Step 2. Realtime updates of Live Job & Step Status
At any point during execution, the system should expose:
- Workflow-level state:
pending,running,success,failed,canceled - Per-step/task status: granular view of each
Task_Runin the DAG - Timing breakdowns: queued time, execution time, retry counts, exit codes
This is driven by a state machine behind the scenes:
- Every job emits transitions (e.g.,
PENDING → RUNNING → SUCCEEDED) - These transitions are captured in a durable database (e.g.,
Task_Attempttable) - A status service subscribes to updates and pushes events to clients via SSE.
A real-time update system with a notification service based on pub/sub works by decoupling senders (publishers) from receivers (subscribers) so updates can flow quickly and scale easily:
- Publishers: Whenever something changes — e.g., a build finishes, a new comment appears, or a job’s status updates — the producing service publishes an event message to a topic in the notification system.
- Pub/Sub Broker: A message broker (e.g., Redis) takes these events and fan-outs them to all interested subscribers without the publisher needing to know who they are or how many exist.
- Subscribers: Services or clients (such as web servers, mobile apps, or WebSocket gateways) subscribe to the topic. When a new event arrives, they immediately receive the message and can push a notification or update their UI.
This pattern enables low-latency, scalable real-time updates, since publishers don’t have to directly contact each client, and the notification service handles delivery, retries, and fan-out.
Deep Dive
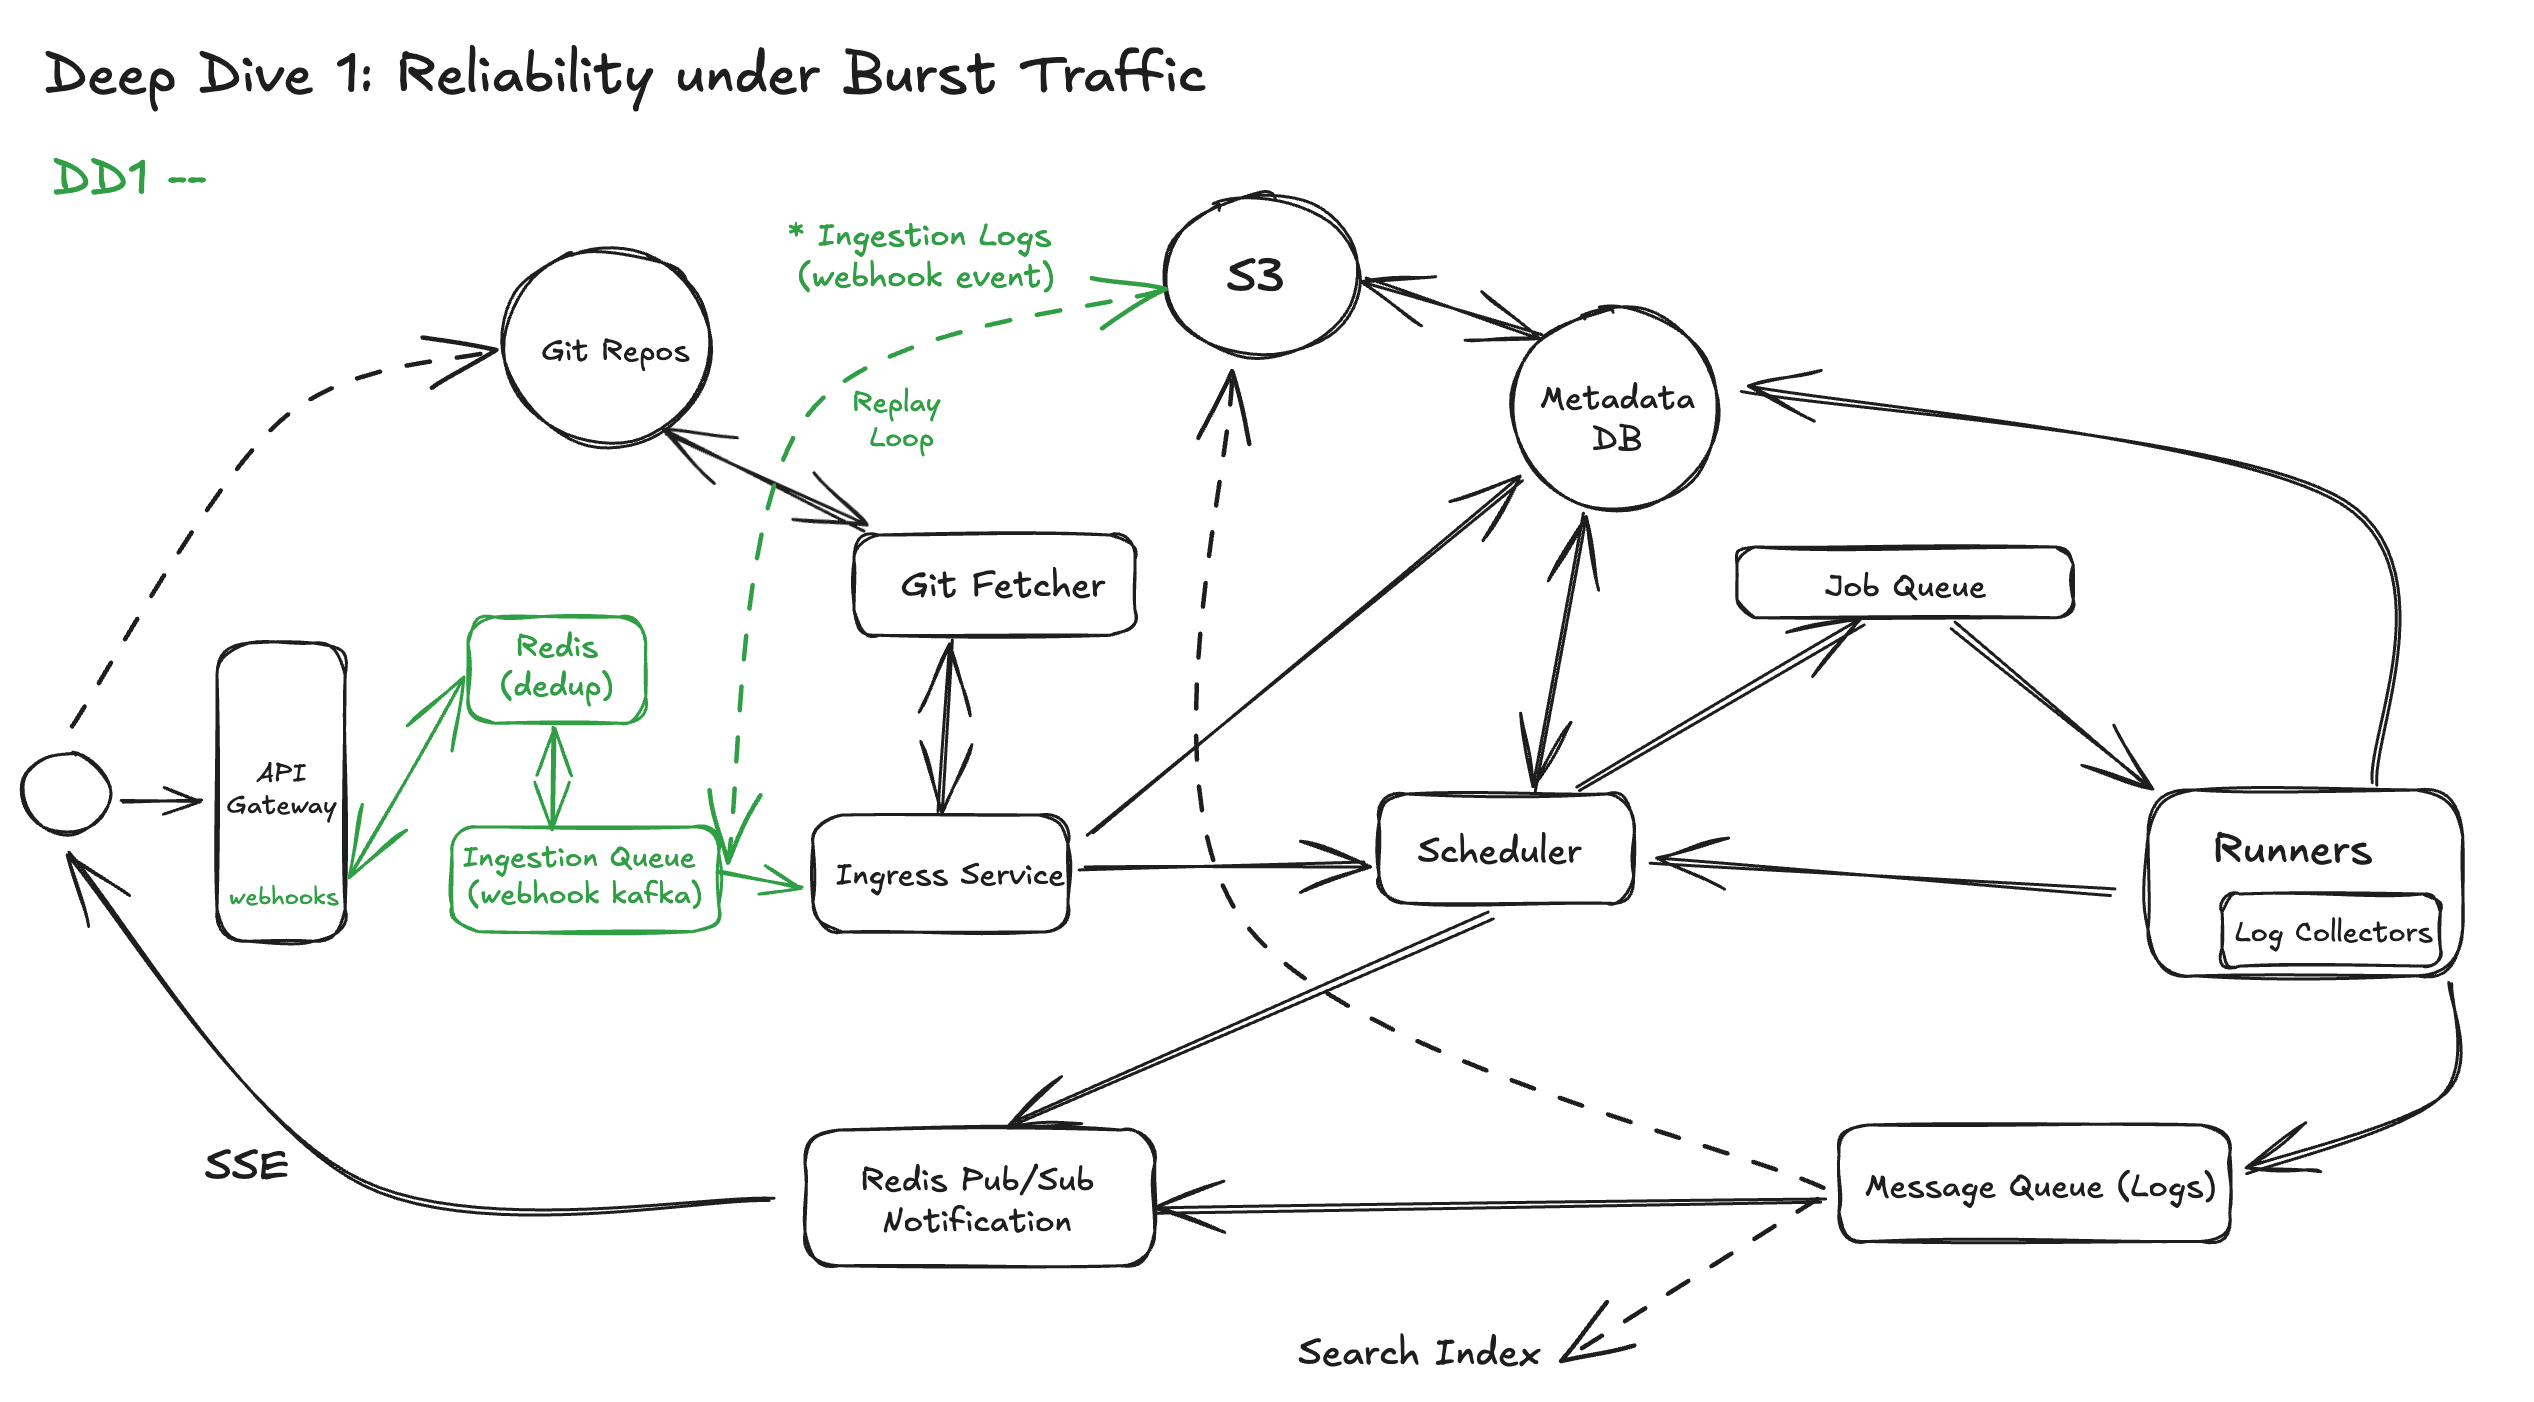
DD1: Reliable Ingestion of Push Events Under Burst Traffic
CI/CD systems need to handle massive webhook volumes — especially during peak hours when thousands of developers push code, merge PRs, or trigger deployments. If ingestion isn’t designed carefully, the system risks:
- Dropped events (due to restarts or network hiccups)
- Duplicate processing (due to webhook retries)
- Coupled latency between webhook and downstream scheduling
So let’s break this down across three core responsibilities:
- Immediate Acknowledgment, Deferred Processing
Webhook providers like GitHub, GitLab, or Bitbucket expect a 2xx response within a few seconds. If your server is slow or restarts mid-request, they’ll retry — sometimes multiple times — resulting in either duplicates or missed events.
To solve this:
- As soon as a valid event is received, we acknowledge with
202 Accepted. - Then we enqueue the event into a durable buffer such as Kafka. This design ensures that event ingestion is fast and reliable — we can immediately acknowledge the webhook provider and absorb bursts of traffic without overloading downstream services.
By decoupling ingestion from processing, we allow workflow builders and schedulers to scale independently, apply retries safely, and recover gracefully from failures. The durable log also gives us strong operational benefits: replay for debugging or backfilling, ordered consumption per repository, and auditability of every event received. Together, these properties protect the system against spikes, backpressure, and downstream outages while preserving correctness and resilience.
- Deduplication for Effectively-Once Delivery
Even with fast responses, webhook providers retry on failures — which introduces at-least-once semantics at the network layer. Without proper handling, you could process the same event multiple times — triggering redundant builds, double deployments, or duplicated artifacts.
To handle this, we implement deduplication at the ingress layer.
How it works:
- Each webhook includes a unique delivery ID in the header:
- GitHub →
X-GitHub-Delivery - GitLab →
X-Gitlab-Event-UUID - Bitbucket →
X-Request-UUID
- GitHub →
- We extract this ID and form a key:
dedup:{provider}:{delivery_id}- This key is checked and stored in Redis with a TTL (e.g., 7–14 days):
- If it exists → duplicate → skip enqueue
- If not → first seen → store and proceed
Downstream systems receive each webhook effectively once, despite retries. A global DB table with unique constraint is safer, but slower under burst load — Redis is the sweet spot for scale.
<aside>💡
What if provider doesn’t send a UUID?
When the provider doesn’t send a UUID, construct a natural key per event type + a payload digest fallback:
Natural keys (examples):
- push:
{repo_id}:{ref}:{after_sha} - pull_request:
{repo_id}:{pr_number}:{action}:{head_sha} - issue_comment:
{repo_id}:{issue_number}:{comment_id}:{action} - tag/release:
{repo_id}:{event_type}:{release_id|tag_ref}:{action} - pipeline/workflow:
{repo_id}:{run_id|workflow_id}:{action}(if present)</aside>
- Durable Event Logging & Replay
Even with deduplication and queuing, systems still fail — nodes crash, disks fill up, downstream services become unavailable.
To make ingestion resilient to unexpected restarts, we:
- Log the raw webhook event to a durable store (e.g., blob storage, write-ahead log)
- Add metadata: delivery ID, received timestamp, validation results
- Optionally support manual or auto replay of missed events by re-publishing from logs
This gives us:
- Auditability (What was received?)
- Observability (How many retries? Which failed?)
- Replayability (Can we reprocess a dropped event safely?)
Diagram Updated:
DD2: Horizontal Scalability of Scheduling and Execution
To scale reliably, we adopt 3 core principles:
- Partition the Workload
Break the global job queue into shards, based on some natural partitioning key:
- Repository
- Organization/tenant
- Workflow run ID hash
Each shard has its own queue, and schedulers can independently process different shards in parallel.
📦 Example:
This approach provides:
- Scalability: no single bottleneck
- Fairness: tenants don't starve each other
- Isolation: failures in one shard don’t impact others
- Distributed Workers + Central Orchestrator
Each scheduler instance runs independently, pulling from its assigned shard. It:
- Selects
READYtasks - Allocates compute (CPU/GPU/zone-specific)
- Pushes tasks to a worker agent or container runtime (e.g., K8s)
Workers report back via heartbeats:
- Status updates:
RUNNING,SUCCESS,FAILED - Logs, metrics, resource usage
This loop is stateless per worker — all orchestration state lives in a shared DB or distributed state store, which allows:
- Failover if a worker dies
- Rehydration after restarts
- Safe reprocessing of incomplete tasks
- Idempotent State Transitions
In distributed systems, things fail and retry constantly:
- Workers crash mid-run
- Messages are duplicated or arrive out of order
- Schedulers race to claim the same task
To avoid inconsistency, every state transition is idempotent.
For example:
- Before running a task, a worker checks
task.status == READY - On retry, the same transition (
READY → RUNNING) is no-op if already complete - Use optimistic locking or versioning to ensure safe updates
This prevents:
- Double execution
- Lost updates
- Race conditions across schedulers
- Elastic Scaling with Autoscaling + Hot Shard Protection
To scale under burst load:
- Use autoscaling policies for workers and schedulers based on queue depth, job latency, or CPU utilization
- Detect and isolate hot shards (e.g., one repo pushing constantly)
- Apply per-tenant rate limits
- Queue jobs separately by org or workflow type
- Prioritize based on SLA, priority class, or fairness policy (e.g., weighted fair scheduling)
Diagram Updated:

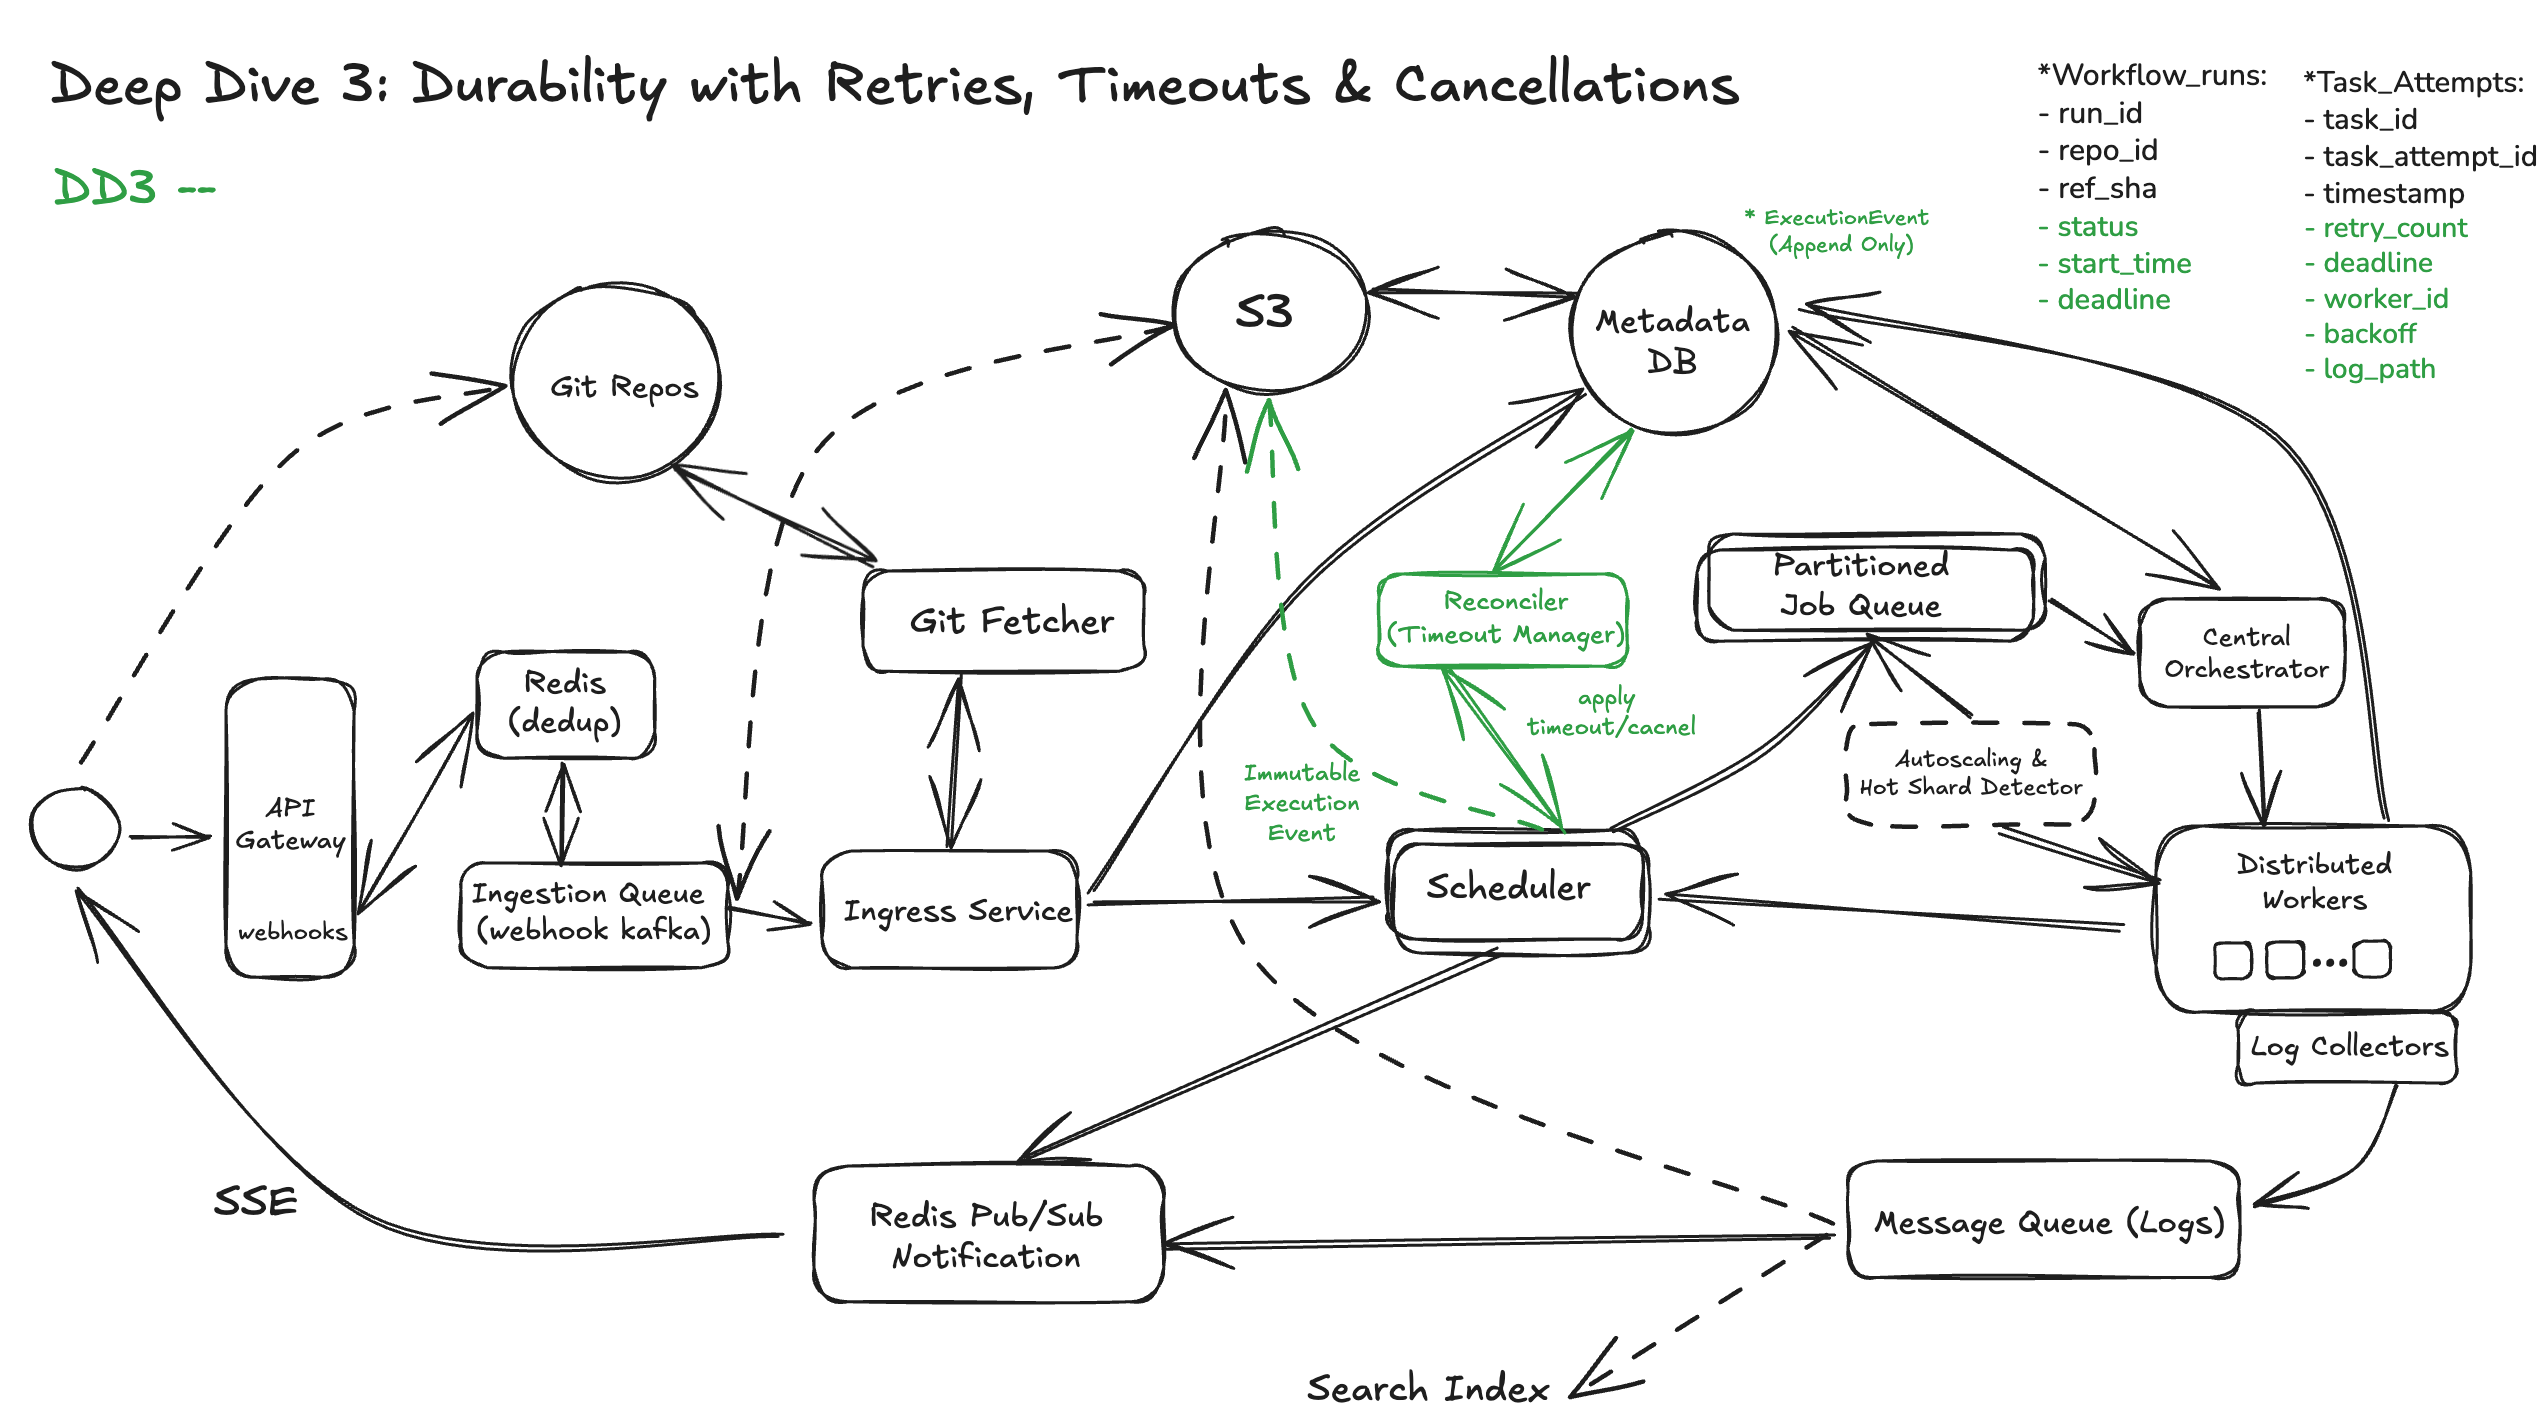
DD3: Durable Workflow Orchestration with Retries, Timeouts, and Cancellations
Let’s walk through the key design decisions for a durable orchestrator.
Rely on Persisted State
A naive system might hold the workflow DAG in memory or rely on in-flight messages for orchestration logic. But this design is fragile:
- If a scheduler crashes mid-run, all state is lost.
- If a retry or timeout is triggered mid-transition, the job may be double-executed or skipped.
Solution: Treat workflow state as durable and queryable data.
This includes:
WorkflowRun: overall execution status and metadataTask: DAG nodes with job definitions and dependenciesTaskAttempt: every execution attempt with exit code, timestamps, and retry infoExecutionEvent (Logs): transitions (e.g.,RUNNING,CANCELED) as immutable logs
This data can be stored in a transactional store (e.g., Postgres, Spanner) or a state machine backend like Temporal/Cadence.
Apply Retries with Backoff
Failures happen — flaky integration tests, network timeouts, container pull errors. A resilient orchestrator supports automatic retries, using:
- Retry budget: max retry attempts (e.g., 5)
- Backoff strategy: exponential backoff with jitter (e.g., 1 sec, 2 sec, 4 sec, 8 sec, 16 sec etc)
- Retryable error classification: no waste of resource on non-retryable errors (e.g., network timeouts = retryable; config errors = not retryable)
Each retry attempt creates a new TaskAttempt, preserving a clean audit trail and avoiding mutation of past runs.
Enforce timeouts
Jobs may hang indefinitely — due to a misbehaving process, a deadlock, or data skew. The orchestrator must enforce:
- Hard timeouts (e.g., 15 minutes per job)
- Global workflow TTLs (e.g., fail all after 2 hours)
- Graceful termination (
SIGTERM→WAIT→SIGKILL)
Timeouts must be reconciled from persisted state so enforcement can resume after restarts or leadership elections.
Key logic:
- Persist
start_timein the DB - Calculate
deadline = start_time + timeout - Periodically check
now > deadlineand apply cancellation
Deal with Cancellations Gracefully
Users may want to cancel workflows due to stale branches, broken configs, or misfires. Cancellations can also cascade from failed parent jobs.
In our philosophy of design, each cancellation must:
- Update the workflow and task status to
CANCELED - Kill any running containers via the executor
- Skip downstream tasks (mark as
SKIPPED(canceled)) - Emit cancellation events for logging and UI to users
Again, cancellations must be persisted — so retries don’t revive canceled jobs, and state is cleanly propagated through the DAG.
In essence, workflow orchestration is not just about job execution—it’s about managing correctness over time, despite failure. Durable, idempotent state is the backbone of that correctness.
Diagram Updated:
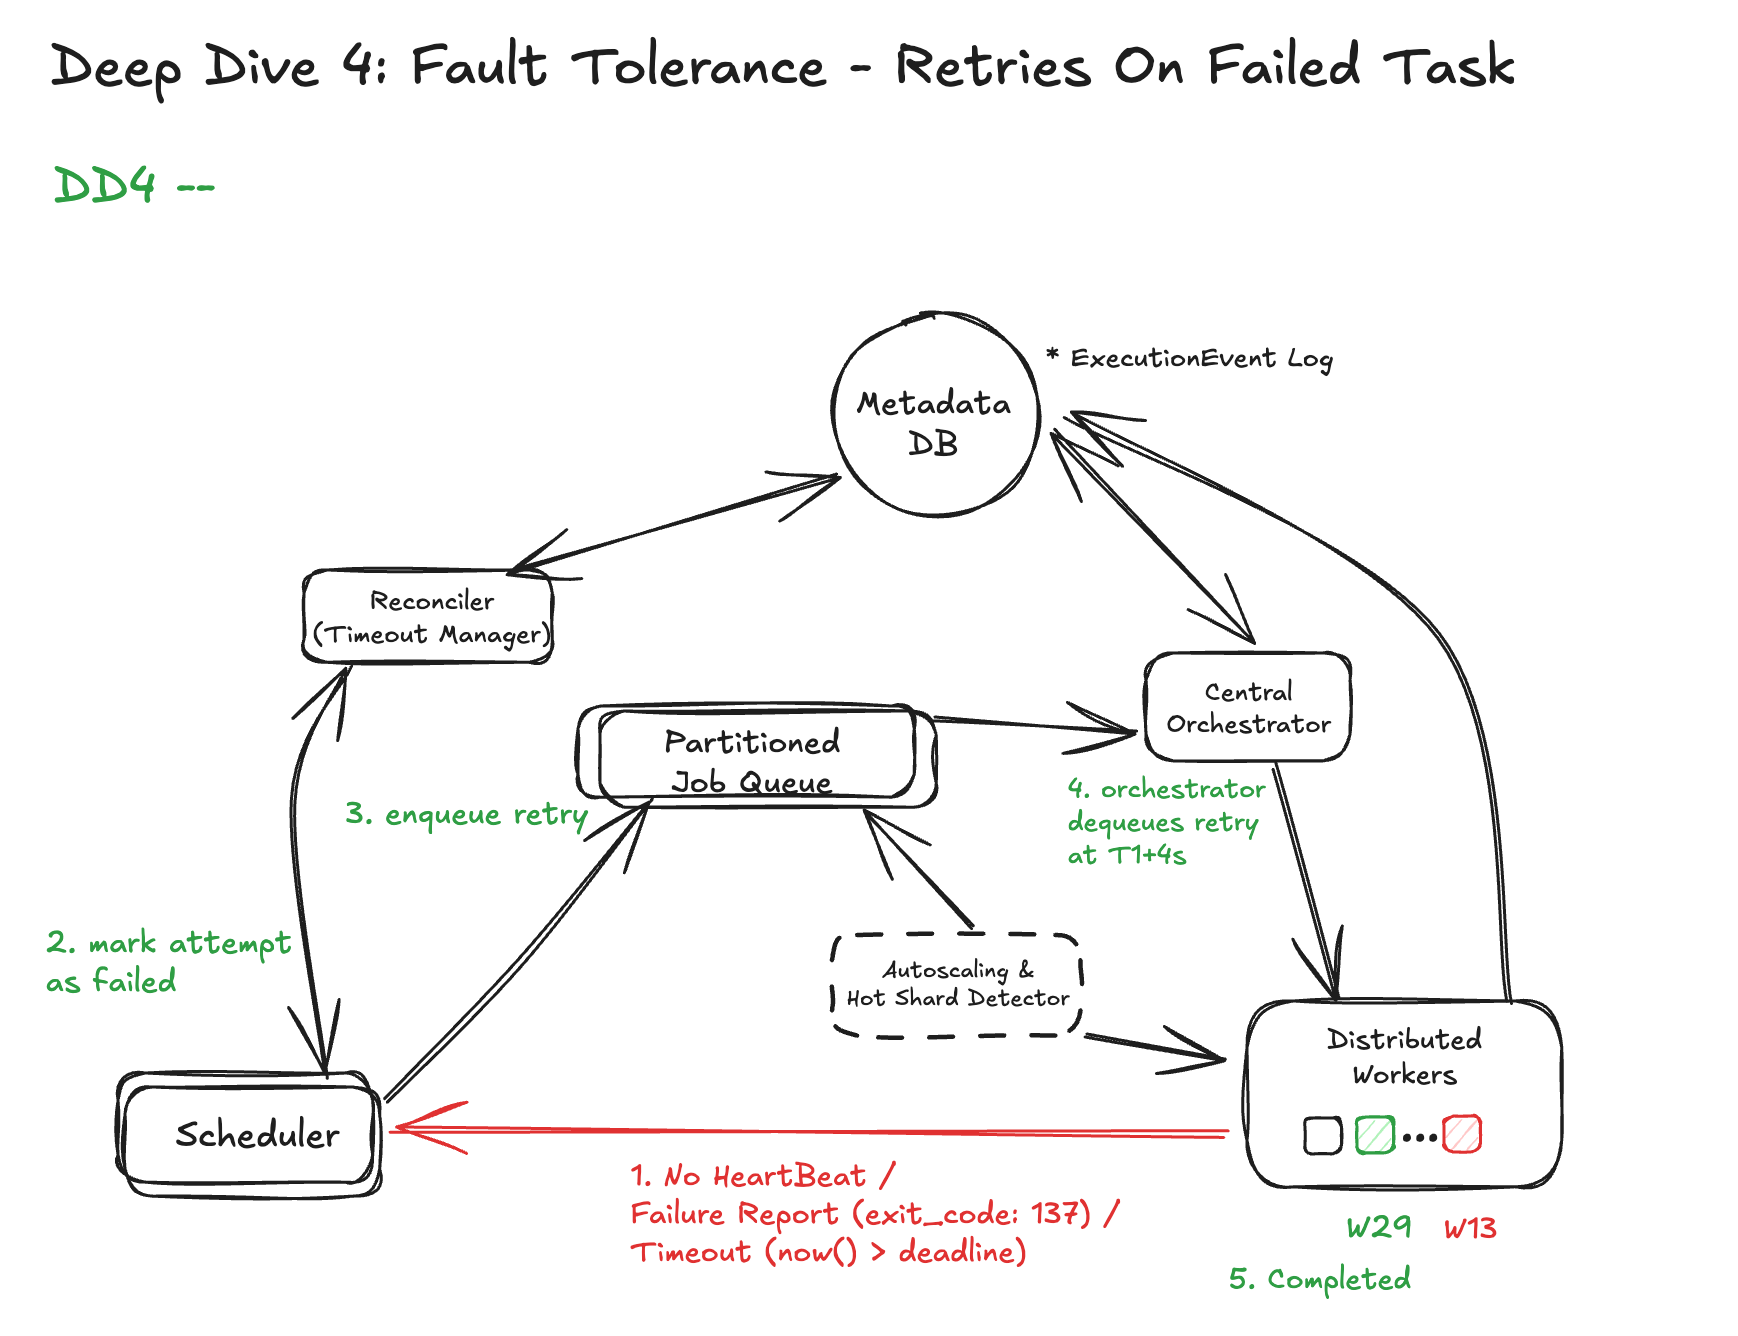
DD4: Fault Tolerance Across Jobs and Infrastructure Failures
Before we discuss how to defend, let’s understand what can go wrong:
Without protection, these failures can lead to:
- Zombie jobs that run forever but are invisible
- Double execution due to retries
- Stuck workflows due to orphaned states
There are list of solutions down below:
- Durable Checkpointing of Job State
Each job should report durable status transitions:
PENDING → RUNNING → SUCCESS/FAILED/TIMED_OUT/CANCELED
These transitions are persisted in a central DB (e.g., Postgres, Spanner) and logged as immutable ExecutionEvents. No job status lives in memory alone.
This allows the orchestrator to recover current state after a crash — for example:
- If a node dies mid-job, the orchestrator sees
RUNNINGwithout heartbeat - After timeout, the job is retried or failed cleanly
Even logs, artifacts, and metadata should be uploaded incrementally (e.g., logs every 5s) so progress isn’t lost on failure.
- Idempotent Execution & Transitions
Retries are inevitable — whether due to worker restarts or network retries.
To avoid duplication and corruption:
- Each job run is tagged with a unique
task_attempt_id - Executors check current state before transitioning
- State updates use optimistic locking or version fields
This means:
- If a task is marked
SUCCESS, replaying aRUNNINGevent is ignored - If a task is retried, only the new attempt ID is allowed to write
- Retry on a Different Runner
If a worker crashes mid-execution:
- The orchestrator detects loss of heartbeat (e.g., 30s TTL)
- Marks current attempt as
FAILED(worker_lost) - Enqueues a new attempt on a different worker
- Downstream steps continue only after a clean success
This ensures no dependency is left incomplete — even if multiple failures occur.
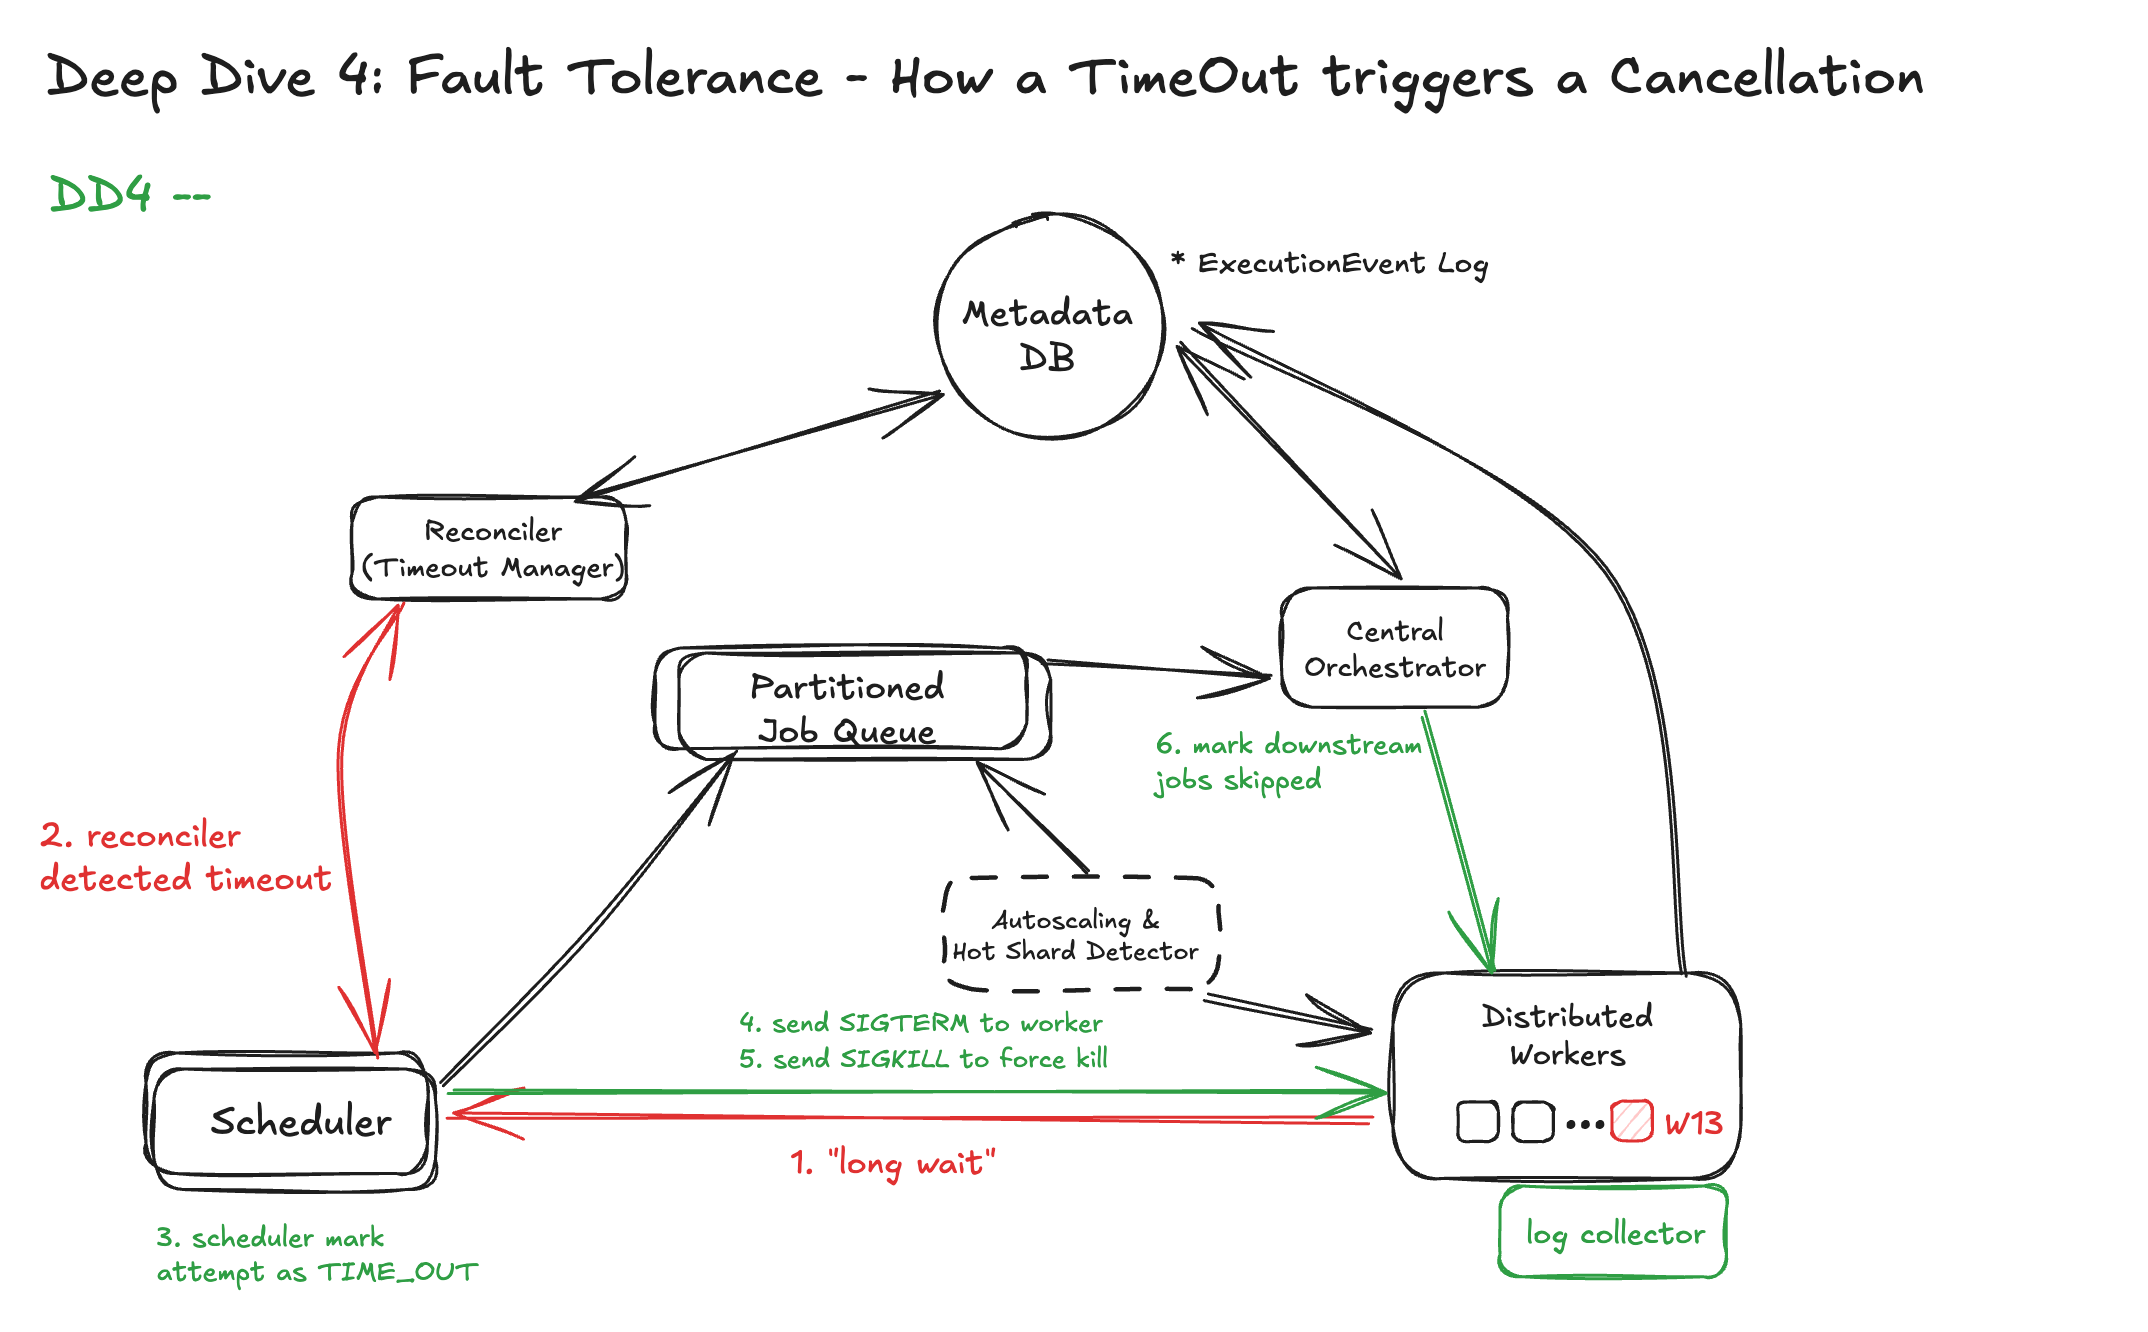
4. Graceful Cancellation & Timeout Handling
When cancelling or timing out a job:
- Send SIGTERM to the container
- Wait for a grace period (e.g., 10s), then send SIGKILL
- Mark the job as
CANCELEDorTIMED_OUTdurably
Downstream jobs depending on this step are skipped with reason propagation, ensuring the DAG stays consistent.
Diagram Updated:
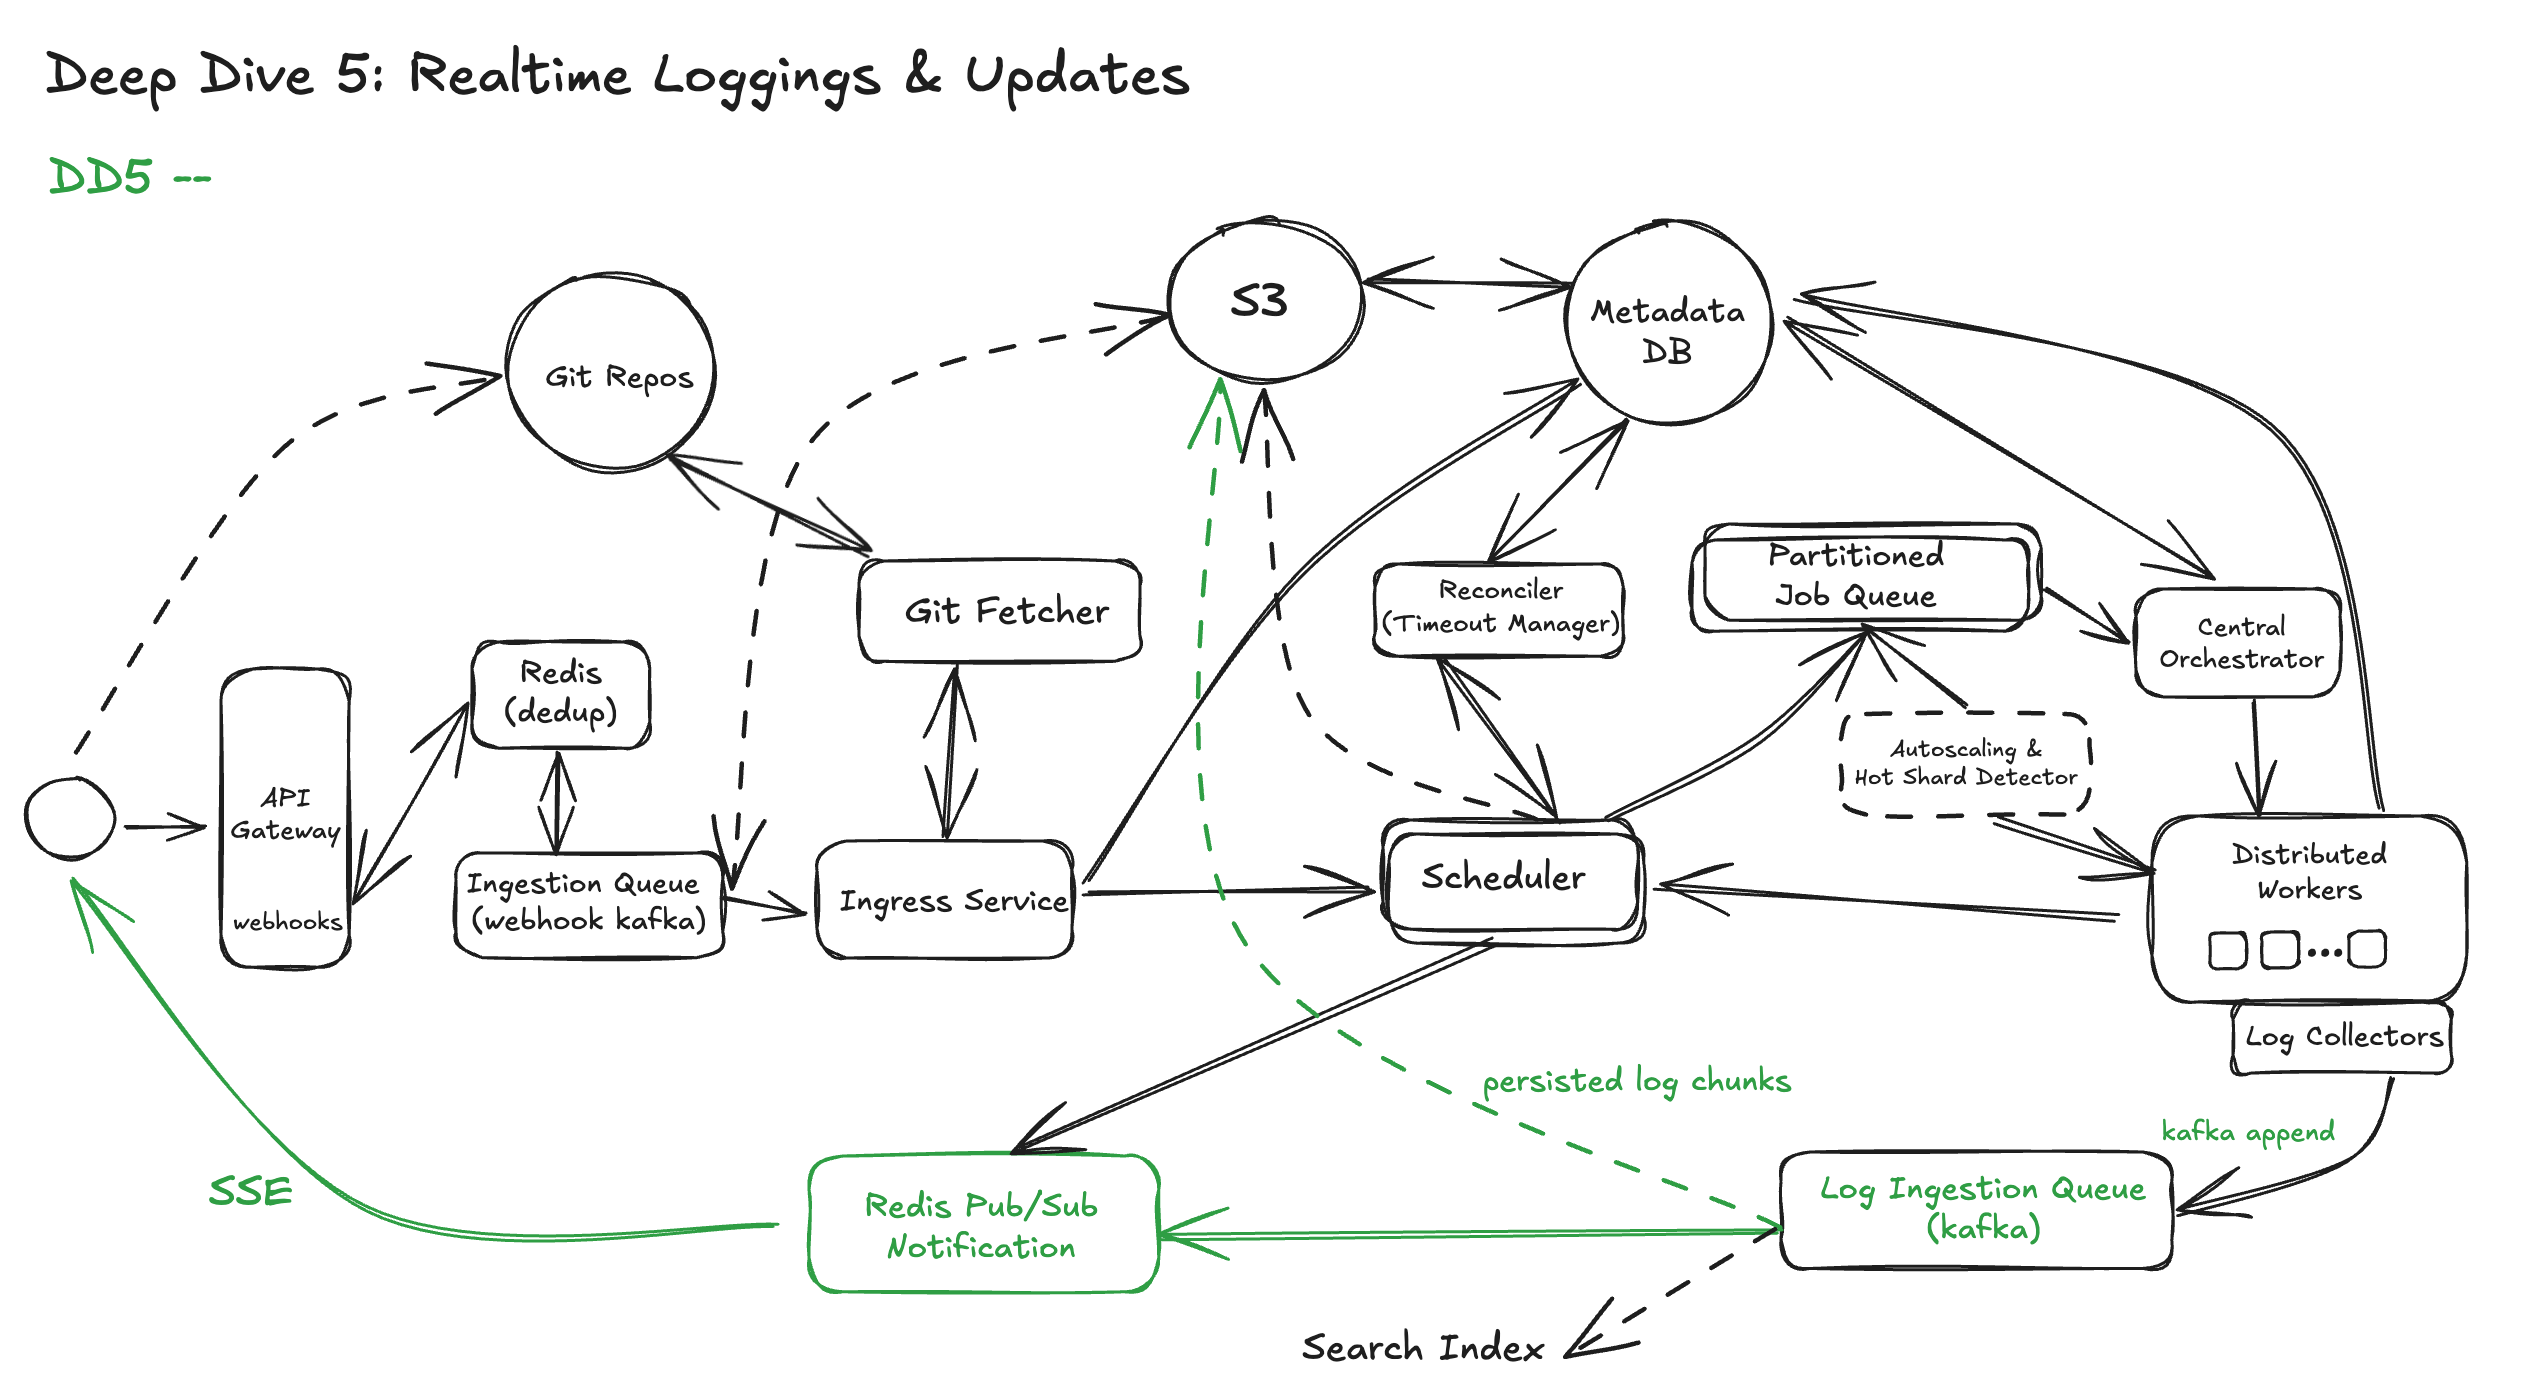
DD5: Real-Time Logs and Status Updates at Scale
A simple implementation might let workers stream logs directly to connected clients or store them immediately in a relational DB. This works fine at small scale, but breaks down quickly:
We need a more robust architecture: Pub/Sub + Object Storage Model. The modern approach separates log ingestion, log fanout, and log storage into three distinct layers:
Ingestion: Worker to Log Ingestor (Pub/Sub)
As the job runs, the worker:
- Streams logs in small batches (e.g., every 2–5 seconds or every 8KB)
- Publishes them into a log ingestion pipeline, such as: kafka
Each log line is tagged with:
workflow_run_idtask_idandattempt_idtimestamp,stream_type(stdout/stderr)
This stream is durable and replayable, so logs aren’t lost if the client disconnects or crashes.
Fanout: Live Log Tailing to Clients
Clients (CLI, web UI, API consumers) connect via:
- WebSocket or SSE (Server-Sent Events)
- Query APIs like:
GET /logs/{workflow_run_id}/{step}?tail=true
The UI subscribes to the log stream using Kafka consumer groups or a log gateway service that:
- Buffers and debounces updates to avoid overloading the browser
- Sends periodic
heartbeatmessages to indicate activity - Handles reconnect/resume using checkpoint offsets
Storage: Persist to Object Storage for History
Once a job completes (or after time windows), logs are:
- Aggregated into chunked files (e.g., gzip-compressed text)
- Uploaded to object storage (e.g., S3, GCS)
- Indexed with metadata for search and retrieval
Storage paths follow a deterministic format:
This enables:
- Long-term retention
- Retrospective debugging and sharing
- Compliance with audit/logging policies
Updated Diagram:
DD6: Secure Management of Secrets in a Multi-Step Workflow
In any CI/CD system, workflow jobs often need access to sensitive credentials — such as cloud provider API keys, Docker registry tokens, or deployment SSH keys. But with great flexibility comes great risk: improper handling of secrets can lead to credential leaks, unauthorized access, or insider abuse
There are two common injection methods: environment variables and volume mounts.
- Environment Variables
Secrets are pulled at task startup and injected into the container’s environment:
Advantages:
- Simple to implement and use — most apps can consume secrets directly from env vars.
- Doesn’t require changes to file paths or mounted volumes.
- Compatible across all container runtimes.
Trade-offs:
- Secrets appear in the process environment; if the app crashes or logs its env, they can leak.
- Available to every process inside the container — no fine-grained scoping.
- Can’t restrict read permissions or rotate easily within long-lived processes.
Best for: short-lived jobs, low- to medium-sensitivity secrets, language-agnostic workflows.
- Volume Mounts (e.g., tmpfs or projected volumes)
Secrets are written into ephemeral, in-memory volumes and mounted into the container file system at known paths (e.g., /secrets/aws/token).
Advantages:
- Secrets can be scoped tightly with filesystem permissions (
chmod 400, owned by the job user). - Avoids putting secrets in process environment.
- Some systems (e.g., Kubernetes, Vault Agent) can auto-rotate secrets on disk.
Trade-offs:
- Requires the app to read from a file path — might need config changes.
- Slightly more complex setup and cleanup logic.
- Mount points must be scrubbed after job completion.
Best for: high-sensitivity secrets, longer-lived jobs, or workflows with file-based integrations (e.g., service account JSONs).
DD7: Artifacts Management and Shared among jobs.
It also handles artifacts—the data that flows between jobs—by storing them in versioned, immutable object storage, ensuring that jobs remain deterministic and that deployments can be traced, verified, and even rolled back without rebuilds.
Once jobs start running, they may produce data needed by downstream jobs—that’s where artifacts come in.
Jobs declare:
artifacts.outputs: files or directories to upload after success.artifacts.inputs: required assets from upstream jobs before execution.
We upload outputs to object storage (e.g., S3, GCS) using structured paths like:
Inputs are validated:
- Existence: must be present before the task is marked ready.
- Checksum: verify SHA256 hash to prevent corruption.
- Access control: tasks can only access artifacts declared in config.
This design is rooted in three principles:
- Artifacts are immutable. Once uploaded, they can’t be mutated—this guarantees reproducibility.
- Deployments are traceable. We can trace any binary in production back to the Git SHA, the
buildtask that produced it, and thetesttask that validated it. - Rollbacks are instant. We can redeploy a prior artifact version without triggering a rebuild, just by restoring from object storage.
DD8: Build Artifact and Optimization
There are several key design decisions, when we talk about artifact building
- Accurate change detection
- Track all build inputs: source files, transitive dependencies, compiler flags, toolchains, environment variables.
- Only rebuild when a relevant input fingerprint changes.
- Dependency correctness
- Build order is derived from an explicit Directed Acyclic Graph (DAG) of targets.
- A downstream target must never run before its prerequisites succeed.
- Missing or misdeclared deps should be surfaced as errors, not silently ignored.
- Reproducible builds
- Same source + same environment ⇒ identical output bits.
- No reliance on developer machine state,
$PATH, or unpinned tools.
- Work reuse / caching
- Local cache to skip recompilation on repeat runs.
- Remote cache to share build outputs across engineers and CI agents.
DD9: Globally Continuously Deployment
Globally Continuous Deployment is an approach where every code change, once built and tested, can be safely and automatically released to all regions and environments without manual gating. The system coordinates rollouts across data centers or clouds, applies staged releases (canary → progressive → full), monitors health signals in real time, and can roll back instantly if needed.